Quick Summary
Particle size in magnetic separation affects mineral liberation, particle movement and how evenly the feed reaches the magnetic field. Finer material may separate better after grinding frees the target mineral, but very fine particles can become harder to disperse and capture cleanly. The useful size range depends on the mineral, separator and operating conditions.
Look at three results together: recovery—how much of the target you keep; grade or purity—how clean the selected product is; and throughput—how much feed you can treat while meeting those targets. A size change can improve one result while reducing another.
For a new application, measure the particle-size distribution and identify whether the target is free or locked inside other particles. For an existing line, find which size fraction carries the loss before changing the magnet, grinding circuit or feed rate.
In this article
Does Finer Grinding Always Improve Separation?
No. Grind finer when the target mineral is still joined to unwanted material and better liberation improves the useful separation. Once the target is sufficiently free, more grinding can create fines that are harder to feed, capture or clean.
Particle size describes the outside dimensions of a particle. Liberation describes whether its mineral components exist as separate particles. A small particle can still contain both magnetite and waste mineral. A larger particle may already be a free grain of magnetite.
When finer grinding helps
Suppose a coarse particle contains magnetite attached to quartz. If the separator captures it, the quartz enters the magnetic concentrate too. If the particle escapes, you lose the magnetite. Increasing attraction changes where that composite particle goes; it does not split the two minerals apart.
Selective grinding can break that attachment. The next separation then has a better chance of sending each mineral to its intended outlet. Use polished-particle microscopy or automated mineral liberation analysis to see whether locked particles are the main problem. A bulk iron assay alone cannot show that attachment.
The 2023 WEEE-slag study by Siddique and colleagues combined size classes, magnetic measurements and mineral liberation analysis. Its method shows why size and mineral composition need to be examined together. A particle’s response reflects the phases it contains, rather than its sieve size alone.
When grinding creates a new problem
If the target is already free, more grinding may add little useful liberation. It can instead produce dust, sticky fines or a harder-to-handle slurry. Fine non-magnetic material can also travel with captured magnetic particles, lowering concentrate grade.
Regrind the fraction that needs liberation, rather than automatically grinding the whole feed finer. Compare the added recovery or purity with the extra fines, grinding duty and downstream water or dewatering load. If finer grinding gives more magnetic product but no better target recovery or quality, examine what else entered that product before extending the grind.
Why Do Fine and Coarse Particles Separate Differently?
Particle size changes the amount of magnetic material in each particle and the forces that influence its path. In practice, the result also depends on distance from the magnet, particle shape, mineral composition and whether particles move separately or in clusters. This is why neither “smaller is better” nor “larger is easier” works as a general rule.
Fine particles: drag, adhesion and carryover
A smaller particle of the same composition contains less magnetic material. Air or water movement can have a greater effect relative to its magnetic attraction. Fine dry material is also more sensitive to electrostatic attraction, moisture and contact with other particles. The separator may receive clusters instead of the individual grains shown in a size report.
Those clusters cause two different problems. A magnetic grain hidden among non-magnetic grains may escape capture. Alternatively, captured magnetic grains may carry unwanted fines into the concentrate. More captured mass therefore does not always mean better separation.
In a wet process, the path and speed of slurry matter alongside magnetic attraction. Dilution may improve dispersion or washing, but adding water at the same dry-solids feed rate also increases the amount of slurry the equipment must handle. The change must be tested as a hydraulic change as well as a concentration change.
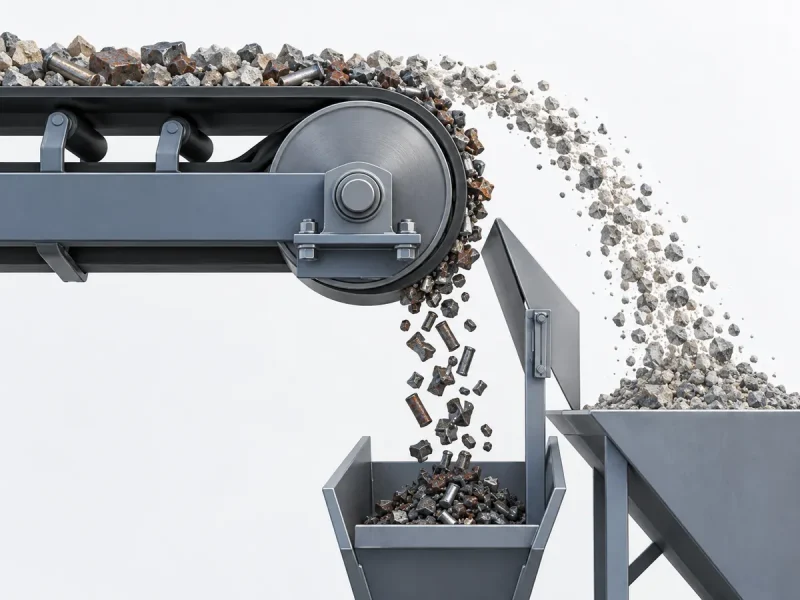
For dry roll separation, first make the layer thin and even. Eriez’s MMPB-730N brochure explains the speed trade-off: a faster belt can reduce layer depth at a given feed rate, but excessive speed makes magnetic retention harder. Slowing the belt while keeping the same feed rate can deepen the layer. Test speed and feed rate together; do not assume one speed change will improve every particle’s path.
Coarse particles: liberation and travel path
Coarse material can contain locked minerals or create a thicker layer. A particle’s center may also pass farther from a high-gradient surface than the center of a smaller grain. Feed position, roll geometry and the splitter—the divider between product streams—then affect where it lands.
Size trends can even reverse between applications. Tripathy and Suresh’s 2017 garnet study reported coarser material in the non-magnetic fraction and finer material in the magnetic fraction under its induced-roll test conditions. That finding does not set the best size for another mineral or roll design. It shows why you need size-by-size results for your own separation goal.
Which Particle-Size Data Should You Measure?
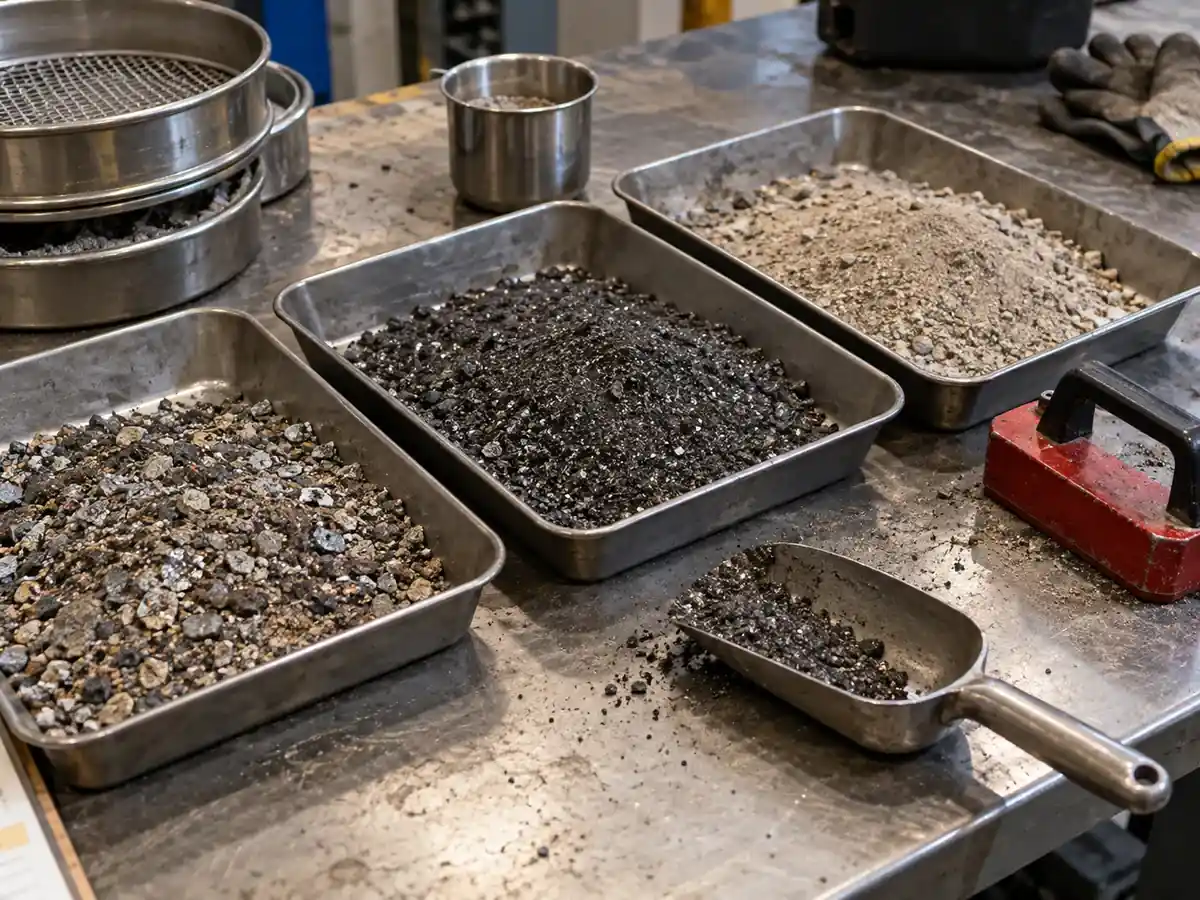
Use the full particle-size distribution, together with the target content in each useful size fraction. A single top size or P80 value is not enough to show where magnetic losses occur. P80 is the size below which 80% of the sample falls on the stated measurement basis; it leaves both the coarse tail and the detailed fines distribution unresolved.
| Data to collect | How to obtain it | How it helps |
|---|---|---|
| Size fractions and their share of the feed | Representative sampling followed by suitable sieving or particle-size analysis | Shows how much material each size range contributes |
| Target content within each fraction | Assay or mineral analysis on the separated size samples | Reveals whether a small fines fraction contains a large share of the target |
| Liberation of the misplaced particles | Examine concentrate and tailings particles by microscopy; use automated mineralogy when needed | Separates a grinding problem from a capture or carryover problem |
| Actual feed condition | Record moisture, visible clumps and dry-feed behavior; for slurry, record solids concentration and flow | Shows whether measured grains reach the separator as separate particles |
| Feed and product size distributions | Analyze matched samples from the inlet and both outlets | Locates the fractions going to the wrong product |
Sample across the stream and across the operating period. A scoop from the top of a stockpile can miss fines that have settled elsewhere. Use an appropriate sample splitter to prepare comparable test portions, and keep the fines rather than brushing them away during handling. The WEEE-slag study used riffle and rotary sample splitting before its size and magnetic classification.
Keep units and test methods visible. 1 mm = 1,000 µm. Record sieve apertures in millimeters or micrometers instead of relying only on mesh numbers. If a laboratory reports a volume-based laser distribution, do not silently treat it as a mass-based sieve distribution; minerals of different density can make those shares differ.
Also record whether the laboratory dispersed clumps before measuring. A dispersed laboratory sample and a damp production feed can have similar primary grains but very different separation behavior. For tramp-metal removal, list the actual metal pieces’ dimensions and shapes separately from the bulk material’s size distribution.
How Should Particle Size Change Equipment Selection?
Use particle size to refine the equipment choice after identifying the separation goal, magnetic response and feed state. Do not choose a dry drum, wet drum or magnetic roller from a millimeter value alone. The same size fraction may need different equipment when its minerals or feed condition change.
| Feed and target | Equipment to evaluate first | What particle size changes |
|---|---|---|
| Dry, free-flowing feed with iron or a strongly magnetic mineral | Dry drum magnetic separator | Layer depth, working distance, feed distribution and discharge behavior |
| Slurry containing liberated, strongly magnetic material such as magnetite | Wet drum magnetic separator | Particle transport, tank flow, magnetic loading and losses in fine tailings |
| Dry, thinly spread feed containing liberated weakly magnetic particles | High-intensity magnetic roller separator | Layer stability, belt speed, splitter setting and whether sizing is needed |
| Fine slurry with a weakly magnetic target | A suitable high-intensity wet separator | Capture geometry, dispersion, slurry flow and the required grade/recovery balance |
| Minerals still locked together | Liberation testing before final equipment selection | Whether selective crushing or regrinding creates a useful separation |
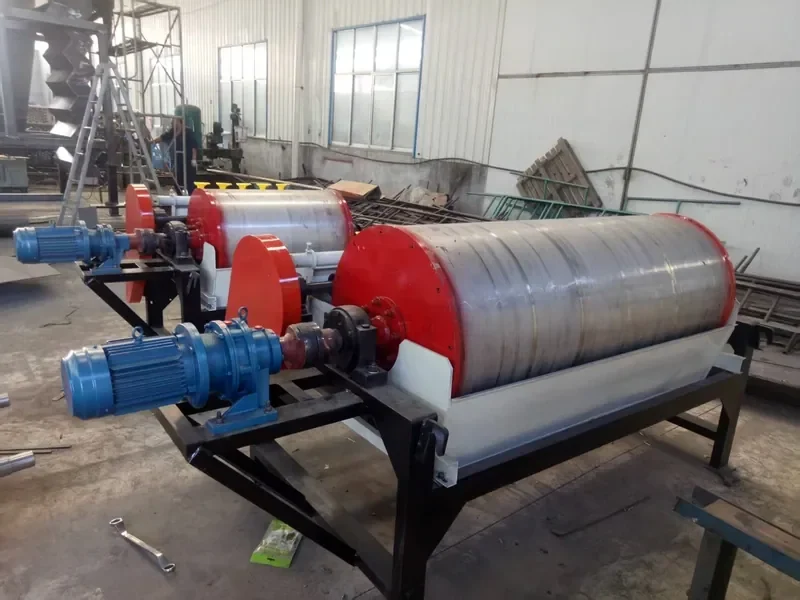
Our dry drum magnetic separator is the starting family for continuous separation of strongly magnetic material from controllable dry feed. If a larger fines share makes the feed clump or surge, improve feed preparation and distribution before increasing the drum’s magnetic duty.
Our wet drum magnetic separator is intended for strongly magnetic targets in slurry. Fine magnetite recovery calls for a suitable slurry path and magnetic loading, rather than simply adding water or choosing a larger nominal drum. A weakly magnetic mineral does not become a standard wet-drum application just because it is fine and wet.
Our magnetic roller separator fits dry, liberated weakly magnetic particles that can pass close to the roll in an even layer. A broad size range may need classification and different settings for separate fractions. Remove large tramp iron before this fine-separation step when it presents an equipment-protection problem.
Ask for the working size range to be demonstrated with representative feed and an agreed product target. A brochure’s smallest listed particle or largest capacity does not identify the size at which your material will meet both recovery and purity requirements. Keep dry-solids throughput, feed width, moisture or slurry flow, and the product specification attached to the comparison.
How Can You Test the Effect of Particle Size?
Split representative feed into useful size classes, test comparable portions, and measure target recovery and product quality for each class. Then test the proposed arrangement on the actual mixed feed. Separate-fraction tests help diagnose the problem; the mixed-feed run shows how fractions interact in production.
Build a test that separates the causes
- Define the product. Decide whether the target belongs in the magnetic concentrate or must be removed from a valuable non-magnetic product. Record the required quality and acceptable loss of valuable material.
- Prepare comparable portions. Sample the normal feed and a difficult expected condition, such as a higher fines share or wetter dry feed. Split each sample, record its size distribution, and preserve its relevant moisture or slurry condition.
- Choose meaningful size cuts. Use cuts that distinguish the suspected loss or liberation problem. Keep every fraction in the balance. If wet screening is needed to separate agglomerated fines, record that preparation rather than treating it as unchanged dry feed.
- Run a baseline and controlled changes. Record separator configuration, feed rate, distribution, speed and splitter position. For slurry, also record dry-solids rate, solids concentration, slurry flow and wash water. Change one factor to identify its effect, then test useful combinations.
- Collect all outputs. Weigh the feed, magnetic and non-magnetic products on a dry-solids basis, including any middlings. Analyze the same target in every stream. Check that both dry mass and target mass account for the feed; investigate missing fines, spillage or unrepresentative samples before trusting the comparison.
- Repeat the promising condition. Compare repeat runs before selecting a setting. Finish with mixed feed at the intended loading and feed condition, including the relevant peak condition.
Use an element assay when elemental recovery is the question. Use mineral-specific measurements when you need recovery of a particular mineral. Total iron recovery is not automatically magnetite recovery if several iron-bearing minerals are present.
Calculate recovery by size, rather than averaging percentages
For any size fraction, use:
Target mass = dry stream mass × target content expressed as a decimal.
Target recovery (%) = target mass in the selected product ÷ target mass in that size fraction’s feed × 100.
For an illustrative calculation, assume a 100 kg dry sample, all smaller than 2 mm, containing 10 kg of the target mineral. The following size cuts and results are set up to demonstrate the calculation.
| Particle-size class | Dry feed mass | Target in feed | Dry magnetic-product mass | Target in magnetic product | Target recovery |
|---|---|---|---|---|---|
| 1 to <2 mm | 40 kg | 4 kg | 8 kg | 3.6 kg | 90% |
| 0.1 to <1 mm | 40 kg | 4 kg | 7 kg | 3.8 kg | 95% |
| <0.1 mm | 20 kg | 2 kg | 3 kg | 1.2 kg | 60% |
| Total | 100 kg | 10 kg | 18 kg | 8.6 kg | 86% |
The overall recovery is 8.6 ÷ 10 × 100 = 86%. Do not average 90%, 95% and 60%: each fraction contains a different share of the target.
The magnetic-product mass yield is 18 ÷ 100 × 100 = 18%. Its target grade is 8.6 ÷ 18 × 100 = 47.8%. These three results answer different questions: target recovery, the mass sent to that outlet, and the quality of that product.
The fine fraction loses 2 − 1.2 = 0.8 kg of target. Total target loss is 10 − 8.6 = 1.4 kg, so the fines account for about 57% of the loss, although they are only 20% of the feed mass. That makes fine-particle behavior the first investigation in this example. Examine dispersion and the fine tailings’ mineral composition before deciding whether the answer is feed conditioning, another recovery stage or a different separator.
For a purification duty, apply the same mass accounting to the impurity, then separately measure valuable material lost with the reject. A lower impurity assay is useful only alongside the retained product mass and its saleable quality.
What Should You Change When One Size Fraction Performs Poorly?
Change the condition that explains the misplaced particles. Start with their size, mineral composition and liberation state; then test feed presentation or machine settings. A low overall recovery number alone does not identify which adjustment will help.
| What the samples show | What to distinguish first | Useful next change |
|---|---|---|
| Coarse tailings contain target mineral attached to waste | Locked composites versus free target grains | Test selective regrinding of the locked fraction; for free grains, examine capture distance and discharge settings |
| Fine tailings contain free, strongly magnetic particles | Poor contact, excessive flow, uneven loading or loss after capture | Stabilize distribution and loading; test slurry flow or dry-layer control before changing equipment family |
| The magnetic product contains many fine non-magnetic grains | Free fines carried with magnetics versus mineral still locked in composites | Test dispersion, feed loading and applicable washing or cleaning stages; regrind only when attachment is the cause |
| Dry performance worsens after humid storage | Clumps and surface coating versus a true change in primary grain size | Compare as-fed and dispersed samples; test feasible conditioning and the worst expected moisture |
| Individual size classes separate well, but the mixture does not | Interactions between fractions and incompatible settings | Test classification into separate feeds, then compare the recombined product and total recovery |
For a dry roll, compare settings at a recorded layer condition. A speed trial that also changes feed depth can hide the cause of improvement. Keep the splitter position recorded too, because moving it can transfer both target and valuable material between outlets.
For slurry, do not keep adding water because the fine fraction looks poorly dispersed. Record the resulting slurry flow and the dry-solids rate. If grade improves but fine target loss rises, compare less dilution with a separate cleaning stage or a tank arrangement suited to the intended recovery duty.
Judge classification by the whole circuit, including every fine or coarse side stream. Screening can make a roll easier to set, but the separated fines still need a destination. Selective regrinding can improve liberation, but its benefit must survive the next separation and any product-moisture requirement.
Particle size in magnetic separation matters because it changes both what is free to separate and how particles reach the magnetic field. The best next step is to identify the troublesome fraction, test the cause and compare recovery, purity and throughput together.
If you are choosing equipment, send us your material, size distribution, target mineral or contaminant, feed condition, normal and peak throughput, and required product result. Include size-by-size test results or a process sketch if available. We can use those details to review the appropriate separator family and configuration.
Particle Size and Magnetic Separation FAQs
Two feed samples have the same P80. Can they use the same settings?
Not from P80 alone. One sample may contain much more material at the very fine end, even though both have 80% below the same size. Compare the full distributions, target content by size, moisture and liberation. If those differ, repeat the relevant feed-rate, flow or splitter tests before carrying the settings across.
Should I remove the finest fraction before magnetic separation?
Only when you have a suitable destination for it and know the target loss. Desliming can improve the remaining feed’s handling or selectivity, but the fine stream may contain valuable mineral. Multiply its dry mass by its target content, then include any separate fines-recovery result in the total circuit balance. Do not report only the improved recovery of the retained coarse feed.
My bulk material is coarse, but the iron is thin flakes. Which size matters?
Record the bulk size for feeding and the flakes’ length, width and thickness for the removal task. A long, thin flake does not behave like a solid particle with the same longest dimension. Its orientation, magnetic response and position in the burden affect capture. Use representative flakes in a controlled test at the actual feed depth and speed, rather than treating the bulk P80 as the contaminant specification.
Why does a laboratory size test look good while plant separation is poor?
First compare how the material was prepared and presented. The laboratory may have dried, dispersed or thinly fed a split sample, while the plant receives clumps, surges or a deeper layer. For slurry, compare solids and liquid flow as well as concentration. Reproduce the relevant plant condition in the trial and sample the plant’s feed and outlets over the same operating period. If the difference remains, compare mineral composition and liberation before attributing it to machine size.